Sensor Accuracy vs Resolution: What the Specifications Really Mean
Accuracy and resolution describe different properties of a measurement. Accuracy is the closeness of agreement between a measured value and the true value of the measurand; resolution is the smallest change in the quantity being measured that causes a perceptible change in the corresponding indication. A sensor can therefore show very fine steps and still have a much larger measurement error.
For industrial sensor selection, do not compare decimal places or bit counts alone. Read the stated error limits, reference conditions, range basis, temperature effects, repeatability, linearity, hysteresis, noise and calibration conditions for the complete measurement chain.
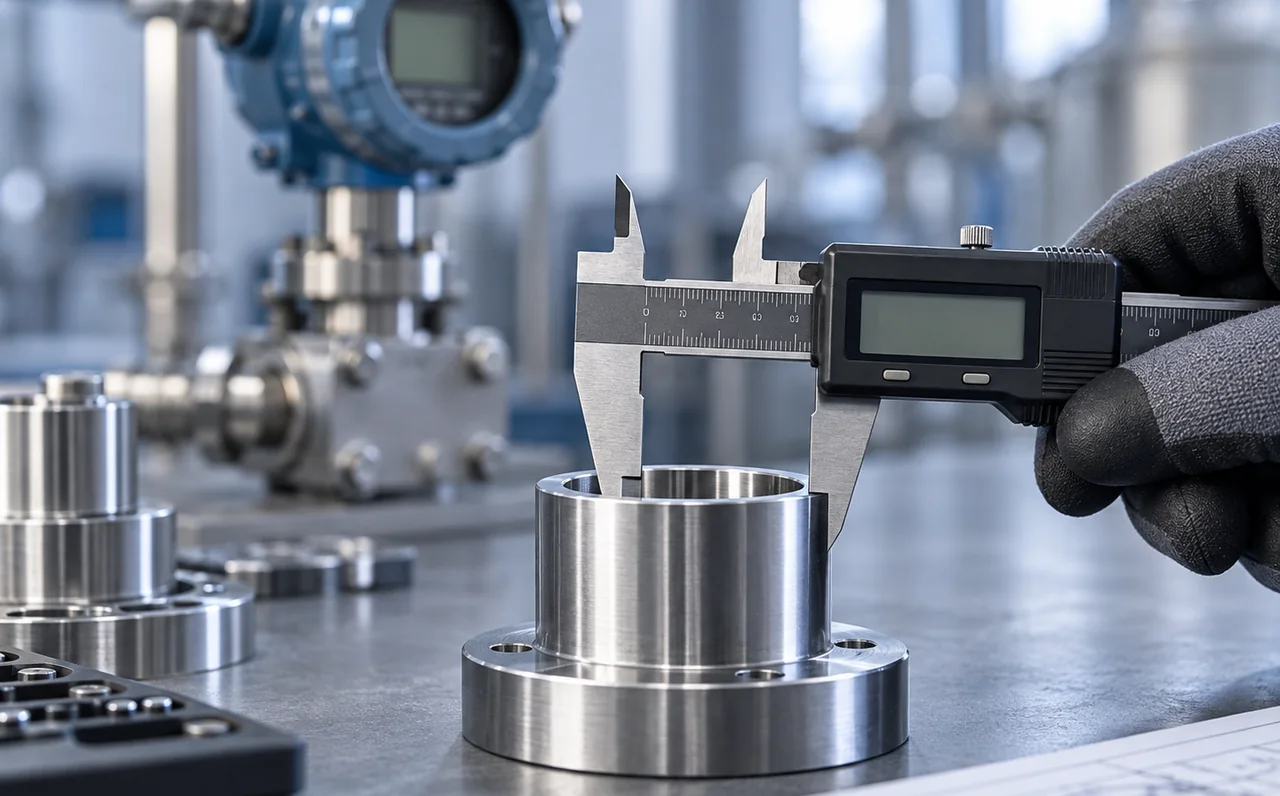
Resolution tells you how finely a change can be distinguished or represented. Accuracy concerns closeness to the true value. Neither term replaces repeatability, uncertainty, linearity, hysteresis, drift or the stated operating conditions.
Accuracy, resolution, precision and repeatability answer different questions
In metrology, measurement accuracy is a qualitative concept: a measurement is more accurate when the measurement error is smaller. Resolution belongs to a measuring system or indicating device and concerns the smallest change that produces a perceptible change in indication. Measurement precision describes agreement among replicate measurements under specified conditions; repeatability is precision specifically under repeatability conditions.
| Term | What it describes | What it does not establish |
|---|---|---|
| Measurement accuracy | Closeness of agreement between a measured value and a true value of the measurand. In formal metrology it is not assigned one numerical quantity value. | It is not the same as precision, repeatability or resolution. |
| Resolution | The smallest change in the quantity being measured that causes a perceptible change in the corresponding indication. | Fine resolution does not prove small bias, low uncertainty or good calibration. |
| Measurement precision | Closeness of agreement among indications or measured values from replicate measurements under stated conditions. | A tightly grouped set of results can still be displaced from the reference value. |
| Repeatability | Measurement precision under repeatability conditions: same procedure, same operators, same measuring system, same operating conditions and location, with repeated measurements over a short period. | It does not by itself establish trueness or absolute measurement error. |
| Trueness | Closeness of agreement between the average of an effectively infinite number of replicate measured values and a reference quantity value. | It is conceptually different from the spread of repeated readings. |
Read the basis of an accuracy claim before comparing the percentage
Two sensors can both advertise “0.25 % accuracy” while imposing very different limits. The percentage may be referenced to full scale, calibrated span, reading, output span or a combination of terms. It may apply only at reference temperature, include linearity and hysteresis, or exclude temperature effects and long-term drift. The number is useful only together with its basis and conditions.
Percent of span or full scale
For a 0–10 bar range with a stated limit of ±0.25 % of span, the numerical limit is ±0.025 bar if the complete 10 bar span is the reference basis.
Percent of reading
A limit expressed as a percentage of reading scales with the indicated or measured value. At low values it can be much tighter than the same percentage of full scale, although many instruments add a separate floor or span term.
Typical conditions hidden behind one headline number
A reliable comparison converts each candidate's specification into the same engineering units at the operating points that matter. If one sensor is specified as percent of span and another as percent of reading plus a fixed term, comparing the headline percentages directly is not meaningful.
Resolution can be limited by the sensing element, electronics, ADC, transmission or display
Resolution is not automatically the number of digits shown on a display. The smallest useful change can be limited earlier in the chain by sensor noise, analogue filtering, mechanical friction, signal conditioning, analogue-to-digital conversion, communication format, PLC input resolution or software rounding.
| Stage | Possible resolution limit | What to verify |
|---|---|---|
| Sensing element | Noise, friction, hysteresis, physical threshold or finite sensor output change. | Noise density, minimum detectable change, bandwidth and test conditions. |
| Signal conditioning | Amplifier noise, filtering, gain choice and excitation stability. | Input-referred noise, bandwidth and how much of the downstream input range is used. |
| ADC / input module | Finite codes, quantisation and effective number of usable bits. | Input range, nominal bit depth, noise, ENOB or effective resolution where provided. |
| Digital transmission | Scaling, integer representation, process-data format or configured decimal places. | Raw data format, scale factor and whether values are rounded before transmission. |
| Display / software | Displayed digit increment or software rounding. | Whether additional digits contain real measurement information or only formatted interpolation. |
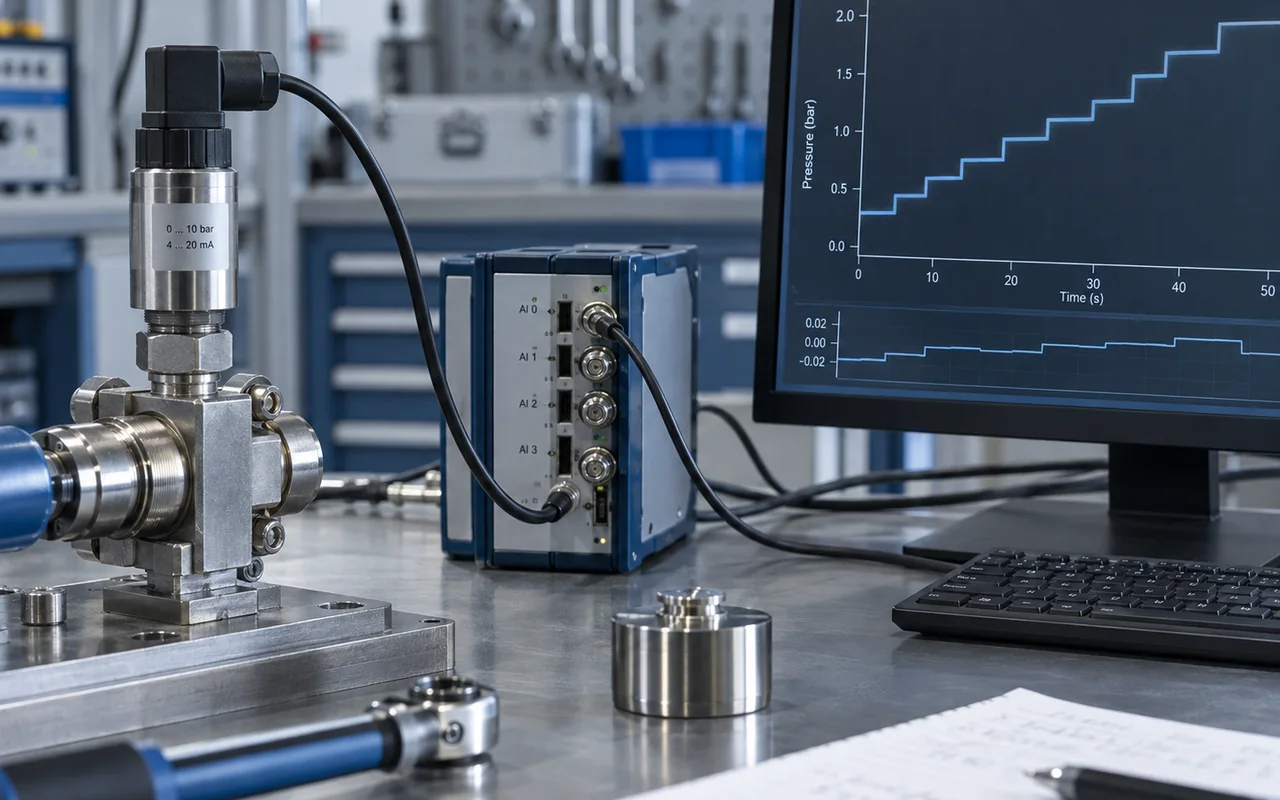
For example, if a 0–10 bar measurement is deliberately mapped across the entire ideal 12-bit digital range, one nominal code step corresponds to about 10 / 4096 = 0.00244 bar. That does not mean the system is accurate to ±0.00244 bar. A separate calibration error of ±0.025 bar would still be about ten times larger than one nominal code step.
Bit depth and decimal places are upper bounds, not guarantees of useful information
A converter may have 16, 20 or 24 nominal bits while the measurement chain delivers far fewer noise-free bits. The reason is simple: if the input fluctuates by many codes because of sensor noise, amplifier noise, interference or process variation, the least significant codes are not stable indicators of a small change in the measurand.
Nominal digital resolution
Nominal resolution follows from the code count and configured input span. It is useful for checking whether a PLC or DAQ input is obviously too coarse for the required process change.
Effective or noise-free resolution
Effective resolution reflects what remains distinguishable in the presence of actual noise and non-ideal behaviour. It depends on bandwidth, filtering, sampling conditions and the signal chain, not simply the converter label.
Averaging can improve effective resolution, but it has limits
Averaging repeated digital samples can reduce uncorrelated random noise and can reveal information finer than one raw quantisation step when sufficient noise or dither moves the signal across adjacent codes. It does not remove a systematic offset, incorrect scale factor, non-linearity or drift. It also trades response speed for noise reduction because the result is based on a longer observation interval.
A sensor can resolve 2.4 mbar steps while its stated error limit is 25 mbar
Consider a 0–10 bar pressure measurement. Assume the complete measurement range is mapped to an ideal 12-bit digital value and the transmitter carries a stated error limit of ±0.25 % of span under the conditions being considered.
- Calculate the nominal digital step. 10 bar / 4096 ≈ 0.00244 bar, or 2.44 mbar per ideal code.
- Calculate the stated span-based error limit. 0.25 % × 10 bar = 0.025 bar, or 25 mbar.
- Compare the two correctly. The system can represent changes much smaller than the stated error limit. That is normal: resolution and error limit describe different properties.
- Check the real installation. If electrical noise produces ±8 mbar fluctuation, the practical ability to distinguish small process changes is already worse than the ideal 2.44 mbar code step.
- Add the missing operating effects. Temperature, repeatability, calibration uncertainty, drift, process connection and the PLC input can further affect the final measurement result.
Compare sensors by a common error model, not by the largest bit count
To compare sensor accuracy and resolution, first put the accuracy-related limits into the same engineering units at the same operating points. Then check effective resolution, repeatability, temperature effects, linearity, hysteresis, drift and bandwidth. A specification is comparable only when the range basis, reference conditions and included error terms are known.
| Datasheet item | Question to ask | Common trap |
|---|---|---|
| Accuracy / error | Percent of span, reading, output, range or a combined formula? | Comparing 0.1 % of reading directly with 0.1 % of full scale. |
| Reference conditions | At what temperature, supply, mounting and calibration state is the claim valid? | Using a room-temperature specification as the plant-wide limit. |
| Resolution | Sensor resolution, ADC bits, transmitted increment, display digit or effective/noise-free resolution? | Treating displayed decimals as independent measurement information. |
| Repeatability | Under what repeatability conditions and over what time interval? | Assuming good repeatability means good absolute accuracy. |
| Linearity / hysteresis | What reference line and test direction are used, and are these terms included in the headline limit? | Adding or comparing percentages based on different definitions. |
| Temperature effect | Separate coefficient, zero/span terms or total error band? | Ignoring a temperature term that exceeds the room-temperature accuracy. |
| Drift / stability | What time basis and conditions apply? | Assuming calibration performance remains unchanged indefinitely. |
| Bandwidth / filtering | At what bandwidth, update rate or filter setting are noise and resolution specified? | Comparing a heavily filtered value with a fast unfiltered measurement. |
The useful specification belongs to the complete measurement chain
A high-performance sensor can be limited by the transmitter, wiring, signal conditioner, analogue input, scaling or process installation. The opposite is also true: an expensive 24-bit acquisition module cannot recover information that was lost in a noisy sensor, an unsuitable range or a mechanically poor installation.
Signal conditioning
Gain, filtering, excitation, isolation and input-range use determine how much of the sensor signal reaches the converter as usable information.
GAIN / FILTER / ISOLATEMeasurement uncertainty
Resolution, repeatability, calibration and other effects can become uncertainty contributions when evaluating a measurement result.
RESULT / DISPERSION / BUDGETCalibration & traceability
Calibration establishes the relationship needed to interpret indications and connects the result to stated references through a traceability chain.
CALIBRATE / REFERENCE / TRACEFinal engineering rule
Specify the smallest process change that must be detected and the largest error or uncertainty the decision can tolerate. Then allocate those requirements across the sensor, signal chain and acquisition system. Resolution should be comfortably finer than the smallest meaningful change, while the error and uncertainty limits must still satisfy the process decision over the required range and operating conditions.