Pulse & Frequency Sensor Outputs: Wiring, Counting & Scaling
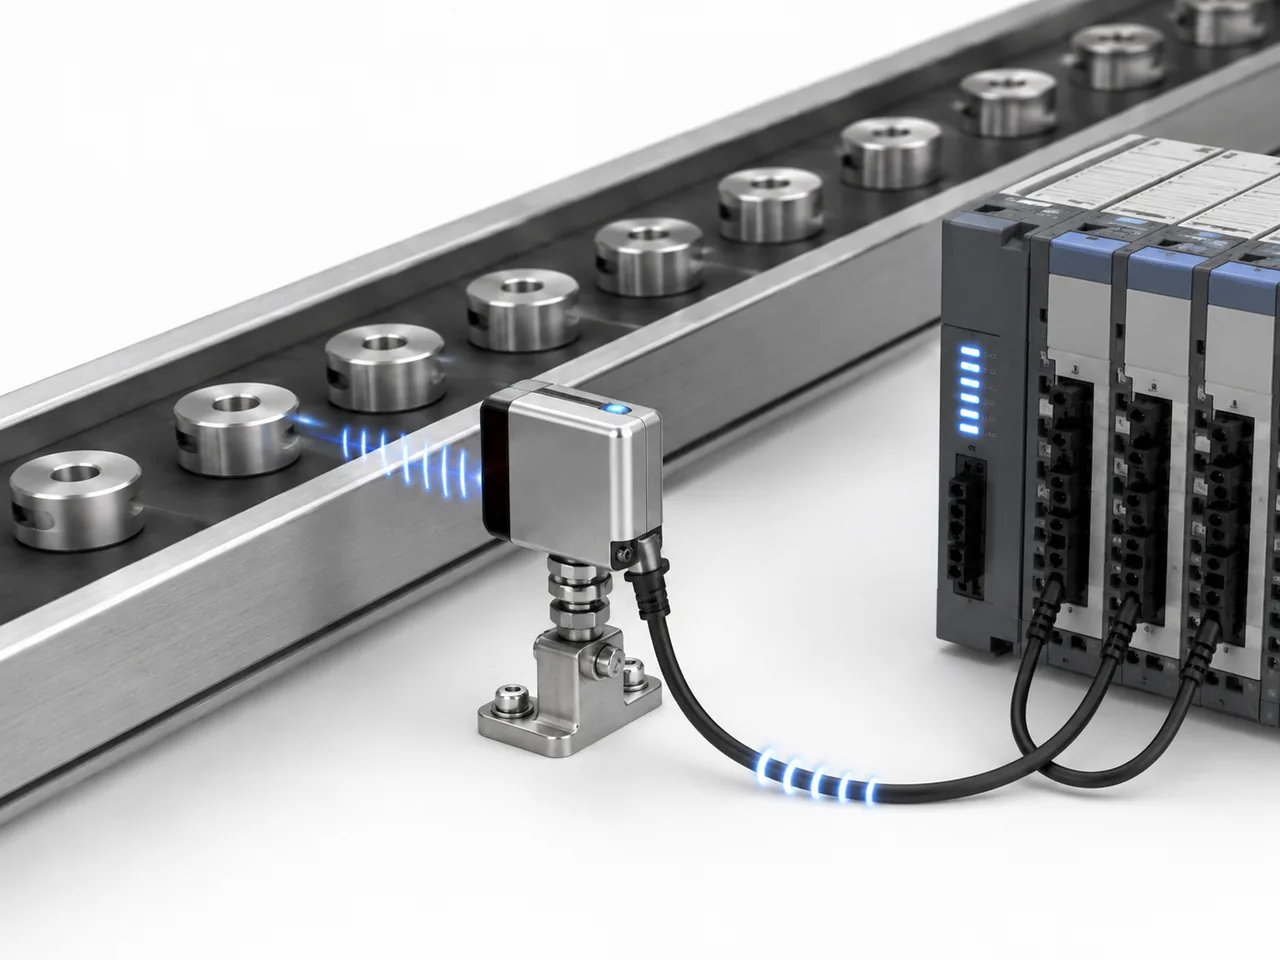
Pulse and frequency outputs both send electrical transitions. In quantity-pulse mode, each pulse represents a fixed amount; in proportional-frequency mode, the pulse rate changes with the measured value. The PLC input must match the output circuit and be fast enough for the shortest pulse and highest expected frequency.
On many sensors and transmitters, the same output terminal can be configured for pulse or frequency. Check what the selected mode represents before choosing the PLC input and scaling.
Matching the voltage is not enough. Check the input's maximum frequency, minimum pulse width, filter setting and whether the sensor uses PNP, NPN/open-collector, push-pull or another output circuit.
What is the difference between a pulse output and a frequency output?
In quantity-pulse mode, each accepted pulse represents a fixed increment, so total quantity comes from counting pulses. In proportional-frequency mode, the pulse rate follows the measured value, so the PLC measures frequency or period to calculate rate. Some devices offer both modes on the same transistor output.
Quantity pulse · count
Each valid pulse represents one event or a defined increment such as 0.1 L, 1 L or one machine cycle. The total increases when another pulse is accepted.
- Primary result: accumulated count or total.
- Scaling is commonly quantity per pulse or pulses per unit.
- Useful for totalisers, batch quantities and event counting.
Frequency · rate
The number of cycles per second changes with the measured value. With a linear proportional-frequency output, a higher process value produces a higher frequency.
- Primary result: instantaneous rate.
- Scaling can use a K-factor or a configured frequency span.
- Useful for speed, flow and other dynamic measurements.
Match the pulse circuit to the PLC input
Pulse outputs are commonly implemented as PNP, NPN/open-collector, push-pull or active voltage outputs. The correct connection depends on which device supplies current, the output voltage and current limits, and the PLC input thresholds. For transistor outputs, PNP and NPN identify the sourcing and sinking current paths.
When does a pulse signal need a high-speed counter?
Use a high-speed counter or dedicated frequency input when the fastest pulse train exceeds what a standard digital input and normal PLC scan are specified to capture. At low pulse rates, a standard input can work if its filter, minimum ON/OFF time and program execution are all fast enough.
A hardware counter captures input transitions independently of normal cyclic program logic. Depending on the PLC, an HSC channel may support event counting, frequency or period measurement, direction inputs and encoder modes.
| Check | Why it matters |
|---|---|
| Maximum input frequency | Must exceed the highest frequency the sensor can produce in the configured operating range. |
| Minimum HIGH / LOW time | Both parts of the pulse must be long enough for the input hardware and configured filter to recognise. |
| Input filter | A filter that suppresses short noise spikes can also suppress legitimate fast pulses. |
| Electrical level | PNP, NPN, active voltage, differential or other outputs require compatible thresholds and current paths. |
| Counting method | Count, frequency and period modes solve different measurement tasks and have different update behaviour. |
| Counter width / rollover | Long-running totalisers must handle counter rollover and retain totals when required. |
How do you scale a quantity pulse?
First check how the device states its pulse value. Some instruments use pulses per unit; others use units per pulse. Do not interchange them: 250 pulses/L is not the same as 250 L/pulse.
Example: if a flow sensor is configured for 250 pulses per litre, a count of 25,000 pulses represents 100 L.
If each pulse represents 0.5 L, 800 accepted pulses represent 400 L. Record the K-factor, engineering unit and selected pulse mode with the PLC program; a replacement instrument can use a different pulse value even when the wiring is unchanged.
How do you convert frequency to an engineering value?
If the sensor uses a K-factor in pulses per unit, frequency can be converted directly to rate. With K in pulses per litre and frequency in hertz, the rate in litres per second is frequency divided by K.
For example, 150 Hz from a sensor with K = 300 pulses/L corresponds to 0.5 L/s, or 30 L/min.
Some transmitters instead let you map a defined frequency span to the process range, such as 0–1000 Hz for 0–250 m³/h. In that case use linear endpoint scaling rather than a raw sensor K-factor.
Frequency, pulse width and filtering set the usable range
Reliable counting requires both ends to support the same timing. Check the sensor's maximum output frequency together with the PLC input frequency, minimum pulse width, duty cycle, filter setting and the quality of the signal edges at the receiver.
| Parameter | Effect on the measurement |
|---|---|
| Maximum output frequency | Sets the fastest pulse rate the sensor or transmitter can produce in the selected mode. |
| Maximum input frequency | Sets the highest rate the PLC counter or frequency channel is specified to capture. |
| Minimum pulse width | Pulses narrower than the receiving input can recognise may be missed. |
| Duty cycle | Determines the relative HIGH and LOW times; both must remain compatible with the receiver. |
| Input filter | Reduces false transitions from interference but can limit usable signal frequency. |
| Cable / edge quality | Long wiring, capacitance and interference can slow or distort edges and create missed or false counts. |
| Zero frequency | May mean a stopped process, no events, lost sensor power or broken wiring unless separate diagnostics are available. |
Cable length and usable frequency must be checked against the sensor and receiver specifications, including the actual cable, routing, switching circuit and required noise margin.
Where are pulse and frequency outputs used?
| Application | Typical interpretation | Main PLC task |
|---|---|---|
| Flow totalisation | Each pulse represents a defined volume or mass increment. | Count pulses and apply the pulse value or K-factor. |
| Instantaneous flow | Frequency is proportional to flow rate. | Measure frequency or period and scale to flow units. |
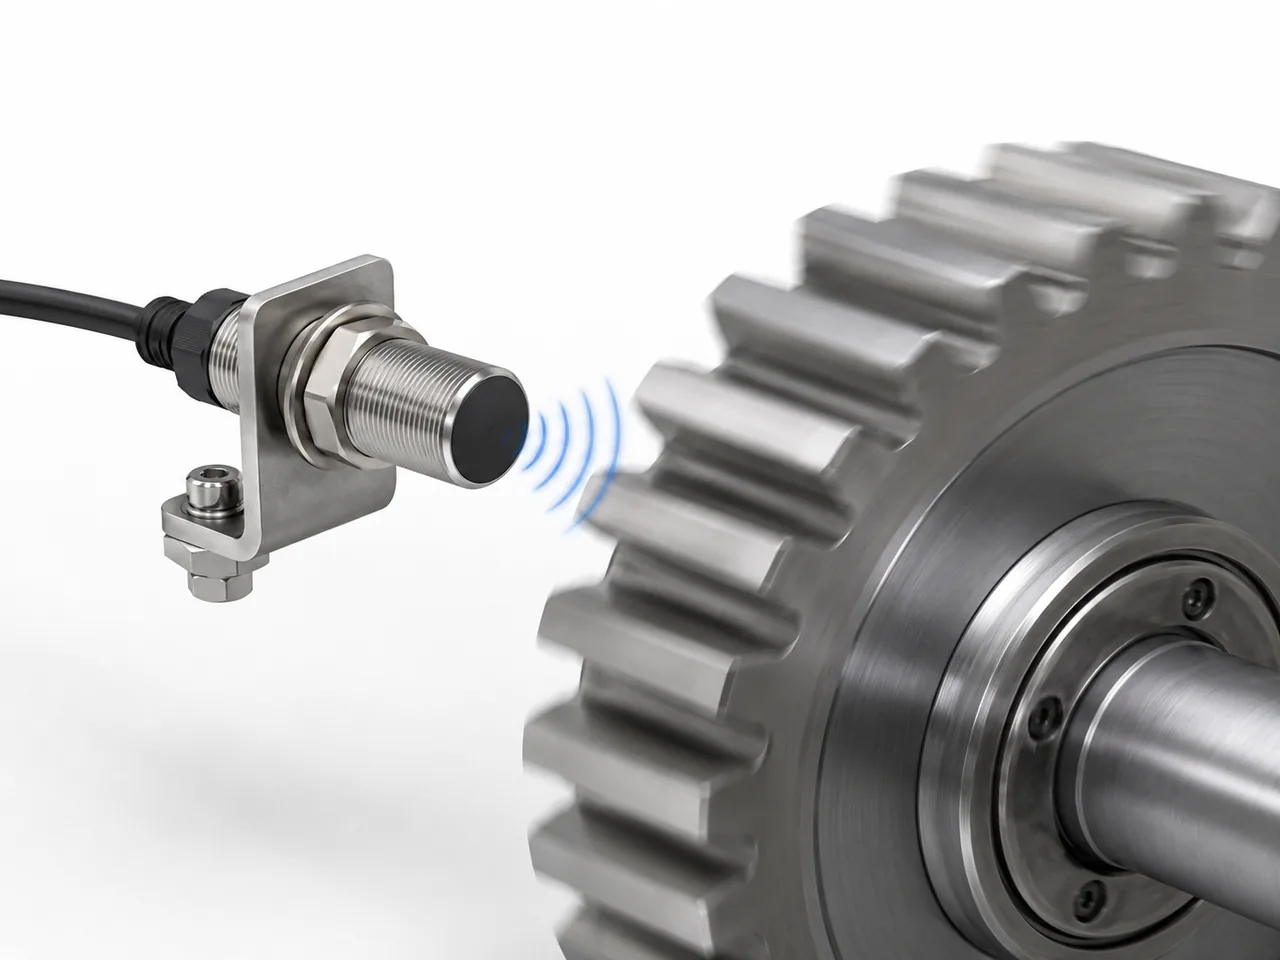
| Rotational speed | Pulses are generated from teeth, targets or encoder increments. | Convert frequency using pulses per revolution. |
| Part / event counting | One valid edge represents one detected event. | Count edges, reject bounce/noise and handle reset or batch logic. |
| Position / encoder | Pulse count represents incremental movement; A/B quadrature can also provide direction. | Use a compatible high-speed or encoder input and the specified evaluation mode. |
For speed from a single pulse train, the basic relationship is RPM = 60 × f / PPR, where PPR is the number of pulses per revolution used by that signal. Encoder specifications can define PPR and edge evaluation differently, so use the device's stated convention.
Troubleshooting pulse and frequency signals
Start at the signal path: confirm that the sensor is producing the expected transitions, that they reach the PLC input, and that the counter or frequency function uses the correct mode and scaling.
- Confirm the output mode. Verify whether the device is configured for quantity pulse, proportional frequency, switching output or another function.
- Check the electrical interface. Confirm PNP/NPN or other output type, supply, common, thresholds, polarity and any required pull-up.
- Check the expected maximum rate. Calculate the highest pulse frequency from the real process range and configured pulse value or K-factor.
- Verify pulse width and filtering. Make sure the input filter and minimum HIGH/LOW times do not reject valid pulses.
- Use the correct input resource. Move the signal to a hardware counter/HSC when ordinary scan-based detection is not guaranteed.
- Compare counter and process values. A correct count with a wrong engineering value points to K-factor, units, time base or endpoint scaling.
- Check for false or missing counts. Inspect wiring, shielding/routing, common reference, edge quality and input diagnostics.
- Test low and high rates. A setup that works at low speed can still fail near maximum frequency, while a short measurement window can make low-frequency values jump.
| Symptom | Likely checks |
|---|---|
| PLC count stays at zero | Wrong output mode, no supply, PNP/NPN mismatch, missing pull-up/current path, wrong terminal or disabled counter. |
| Count is lower than expected | Input too slow, filter too long, pulse too narrow, maximum frequency exceeded or poor edge quality. |
| Count increases when process is stopped | Electrical interference, floating input, incorrect common, contact bounce or filter setting. |
| Total is wrong by a fixed factor | Pulses/unit versus units/pulse confusion, wrong K-factor, unit conversion or edge-counting mode. |
| Frequency value jumps at low rate | Measurement window too short; consider a longer gate time or period measurement. |
| Works slowly, fails at full speed | Maximum output/input frequency, pulse width, duty cycle, filter and cable edge distortion. |