Sensor & Measurement Terminology: Accuracy, Precision, Resolution & More
Sensor specifications use related terms that are not interchangeable. Accuracy describes closeness of agreement between a measured quantity value and a true quantity value of the measurand, precision describes agreement among repeated results, resolution is the smallest distinguishable change, and measurement uncertainty characterises the dispersion of quantity values attributed to the measurand from the information used.
Read every specification together with its stated conditions, reference method and units. A sensor can have fine resolution but poor accuracy, good repeatability but a large systematic offset, or a fast sampling rate with insufficient analogue bandwidth.

Formal metrology and manufacturer datasheets do not always use words in exactly the same way. When a datasheet gives a numerical “accuracy” such as ±0.5% of span, treat it as a specified error limit under stated conditions rather than assuming that the number is measurement uncertainty.
What is being measured must be defined before the sensor specification
A quantity is a property that can be expressed by a number and a reference such as a unit. The measurand is the quantity intended to be measured. “Temperature” is a quantity; “fluid temperature at the outlet, 50 mm downstream of the valve, after thermal equilibrium” is a much more complete measurand. Location, timing, averaging and operating conditions can be part of the definition.
| Term | Meaning | Practical note |
|---|---|---|
| Measurand | The quantity intended to be measured. | Define where, when and under what conditions the quantity exists. |
| Indication | A value provided by a measuring instrument or measuring system. | An indication may require scaling, correction or a calibration relation before it becomes the reported measurement result. |
| Measured quantity value | A quantity value representing a measurement result. | It is not automatically identical to a raw ADC count, displayed digit or transmitter current. |
| Influence quantity | A quantity that does not directly represent the measurand but affects the relation between indication and result. | Ambient temperature, supply voltage, mounting stress and electromagnetic interference are common examples. |
Accuracy, trueness and precision describe different aspects of measurement quality
Accuracy is the closeness of agreement between a measured value and the quantity value used as the reference for the measurement. In formal metrology it is a qualitative concept, not a numerical quantity by itself. Precision concerns agreement among repeated indications or measured values under specified conditions. Trueness concerns how close the average of many repeated results is to a reference quantity value.
Good precision, poor trueness
Repeated readings cluster tightly but are displaced from the reference. A stable zero offset or scale error can produce this pattern.
- Low spread between repeats
- Systematic difference from reference
- Calibration or correction may reduce the systematic component
Good trueness, poor precision
The average can be close to the reference while individual readings vary substantially.
- Large short-term scatter
- Mean value may still be close to reference
- Noise, instability or uncontrolled influence quantities can dominate
Repeatability keeps conditions similar; reproducibility allows specified conditions to change
Repeatability is measurement precision under repeatability conditions: the same or equivalent procedure, operator, measuring system, location and short time interval are kept as constant as practical. Reproducibility is precision under reproducibility conditions, where specified factors such as operator, instrument, laboratory, location or time are deliberately allowed to differ.
| Question | Repeatability test | Reproducibility test |
|---|---|---|
| Sensor | Same sensor and signal chain | May include another equivalent instrument or system |
| Operator / setup | Kept as unchanged as practical | Specified changes are allowed or required |
| Time | Short interval | Can include longer intervals |
| What it exposes | Short-term scatter and measurement noise | Sensitivity to changed measurement conditions |
A repeatability value is meaningful only when its test conditions, number of cycles and statistic are known. A quoted “±0.1% repeatability” without stating whether it is a maximum deviation, range, standard deviation or another metric is incomplete.
Measurement error and measurement uncertainty are not interchangeable
Measurement error is the difference between a measured quantity value and an appropriate reference quantity value. It can contain systematic and random components. Measurement uncertainty is a non-negative parameter that characterises the dispersion of quantity values that could reasonably be attributed to the measurand from the information used.
A component that produces a consistent or predictable shift. Examples include zero offset, scale-factor error and a temperature-dependent bias.
A component that varies unpredictably between repeated observations. Electrical noise, short-term instability and repeatability scatter can contribute.
A numerical value applied to compensate for an estimated systematic effect. Applying a correction does not remove the uncertainty associated with that correction.
Describes the dispersion associated with the measurement result. It is not simply the absolute value of measurement error and should not be treated as a tolerance.
Range identifies the usable interval; span is the numerical difference between its limits
For a sensor configured from 0 to 100 bar, the measuring interval is 0…100 bar and the span is 100 bar. For −50 to +150 °C, the span is 200 °C. “Full scale” is widely used in datasheets but can mean the upper range value, the span, or a full-scale output depending on the manufacturer, so the denominator behind a percentage specification must be checked.
| Expression | Meaning in practice | Check before using it |
|---|---|---|
| Measuring range / interval | Values for which the instrument is specified to provide measurement results within stated performance limits. | Whether limits change with temperature, target, mounting or output configuration. |
| Span | Difference between the upper and lower range values. | Do not confuse span with upper range value when the lower range is non-zero or negative. |
| Overrange | Input beyond the normal measuring interval that the device may tolerate or indicate. | Overrange survival is not necessarily a valid measurement range. |
| % FS / % span / % reading | Different reference bases for a percentage specification. | The numerical error can differ substantially across the range. |
Sensitivity is a transfer slope; resolution is the smallest distinguishable change
Sensitivity describes how much the indication or output changes for a corresponding change in the input quantity. Around a linear operating point it is the slope of the transfer characteristic. Resolution is the smallest change in the measured quantity that produces a distinguishable change in indication. Neither term by itself states the measurement accuracy.
Digital resolution
One count or one least-significant bit defines the smallest code step, but electrical noise, quantisation, filtering and sensor noise can make the effective measurement resolution coarser.
Threshold and dead band
A threshold is the smallest input change that produces a specified detectable response. Dead band is an interval through which the input can change without a detectable change in output, often influenced by friction, backlash, switching logic or hysteresis.
Static sensor errors depend on both the transfer curve and measurement history
Linearity describes how closely a transfer characteristic follows a specified straight reference line. A non-linearity percentage is incomplete unless the reference line is known; common methods include terminal-point and best-fit straight-line definitions. Hysteresis is the difference in indication at the same input value when that value is approached from different directions or after different input histories.
| Term | What changes | Typical cause or concern |
|---|---|---|
| Zero offset | Output at the reference zero condition | Initial calibration, mounting stress, electronics or temperature |
| Span / gain error | Slope of the transfer relation | Sensitivity tolerance, reference error or scaling |
| Non-linearity | Deviation from the specified reference line | Sensor physics, mechanics or signal conditioning |
| Hysteresis | Indication at the same input depends on direction/history | Mechanical friction, magnetic effects, material behaviour or sensor construction |
| Drift | Indication or calibration relation changes with time | Ageing, stress relaxation, contamination or long-term electronics change |
Temperature coefficient is not the same as long-term drift. A temperature coefficient describes a specified change with temperature; drift describes change with time in metrological properties. In practice both may appear as a changing zero or span if operating conditions are not recorded.
Response time, bandwidth and sample rate describe different parts of dynamic performance
A sensor and its signal conditioning form a dynamic system. Response time states how long the output takes to reach a specified condition after an input change. A first-order time constant is the time required to reach about 63.2% of the final response after an ideal step. Bandwidth defines a frequency interval over which response remains within stated amplitude or phase limits.
Must state the criterion, such as 10–90%, 0–90% or settling within a tolerance band. Different criteria give different numbers.
Useful for approximately first-order systems. Real sensors can have multiple thermal, mechanical or electrical time constants.
Specifies the usable frequency range of the sensor or complete channel. The −3 dB point is common but not universal.
How often a digital system records values. It does not define the analogue sensor bandwidth and does not by itself prevent aliasing.
Calibration establishes a measurement relation; adjustment changes the instrument
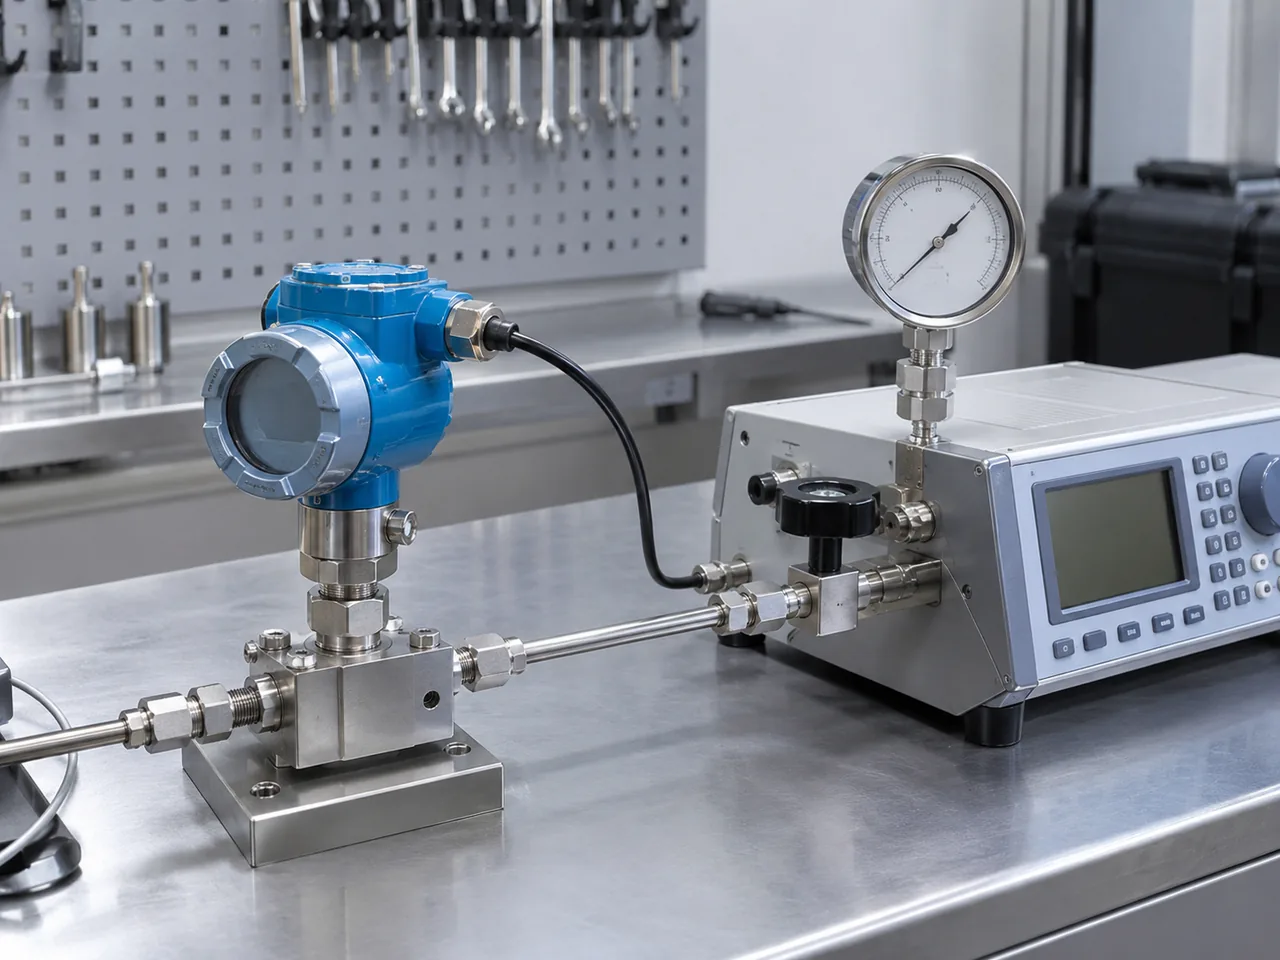
Calibration compares an instrument or measuring system with appropriate reference standards under specified conditions and establishes the relation needed to obtain measurement results from indications. Adjustment is an intervention that changes the measuring system so that it provides prescribed indications. A device can therefore be calibrated, found out of tolerance and left unchanged, or it can be adjusted and then calibrated again.
| Term | Purpose | Does it change the instrument? |
|---|---|---|
| Calibration | Establish the relation between reference quantity values and instrument indications, including relevant uncertainties. | Not inherently |
| Adjustment | Change the measuring system so its indications meet a required relationship. | Yes |
| Verification | Provide objective evidence that specified requirements have been fulfilled. | No |
| Metrological traceability | Relate a measurement result to a reference through a documented unbroken chain of calibrations, each contributing to measurement uncertainty. | No |
- Read the complete specification. Record the reference basis, units, operating conditions and whether a value is typical, maximum or guaranteed.
- Separate error limits from uncertainty. A product tolerance, calibration result and measurement uncertainty statement answer different questions.
- Keep raw indication and corrected result distinct. Document scaling, calibration coefficients and corrections applied by the transmitter, PLC, DAQ or software.
- Preserve calibration conditions. A calibration result is only directly applicable when the measurement model and relevant influence quantities remain compatible with the calibration conditions.
- Check terminology before comparing products. Two manufacturers may use the same heading for specifications calculated by different methods.